Introduction
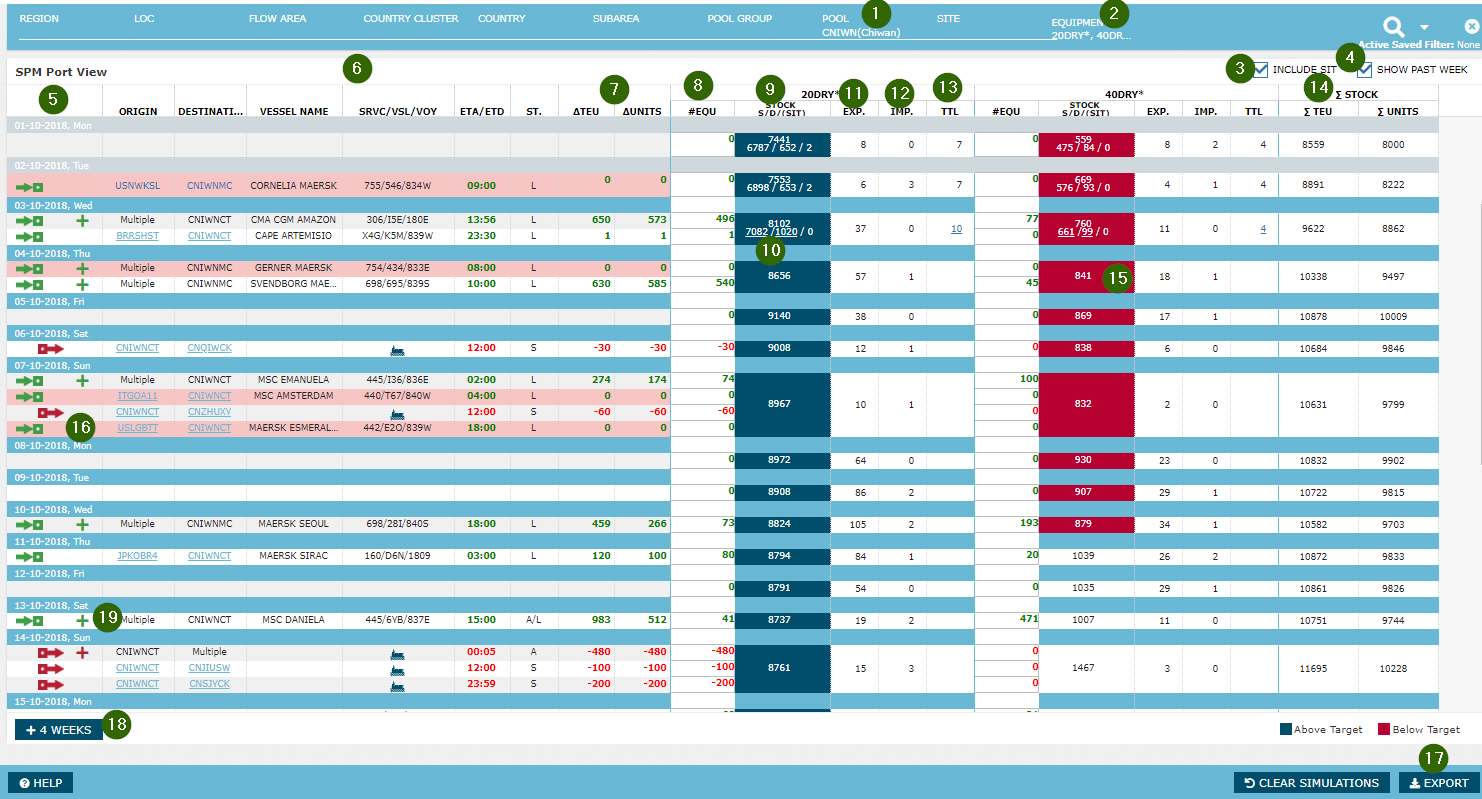
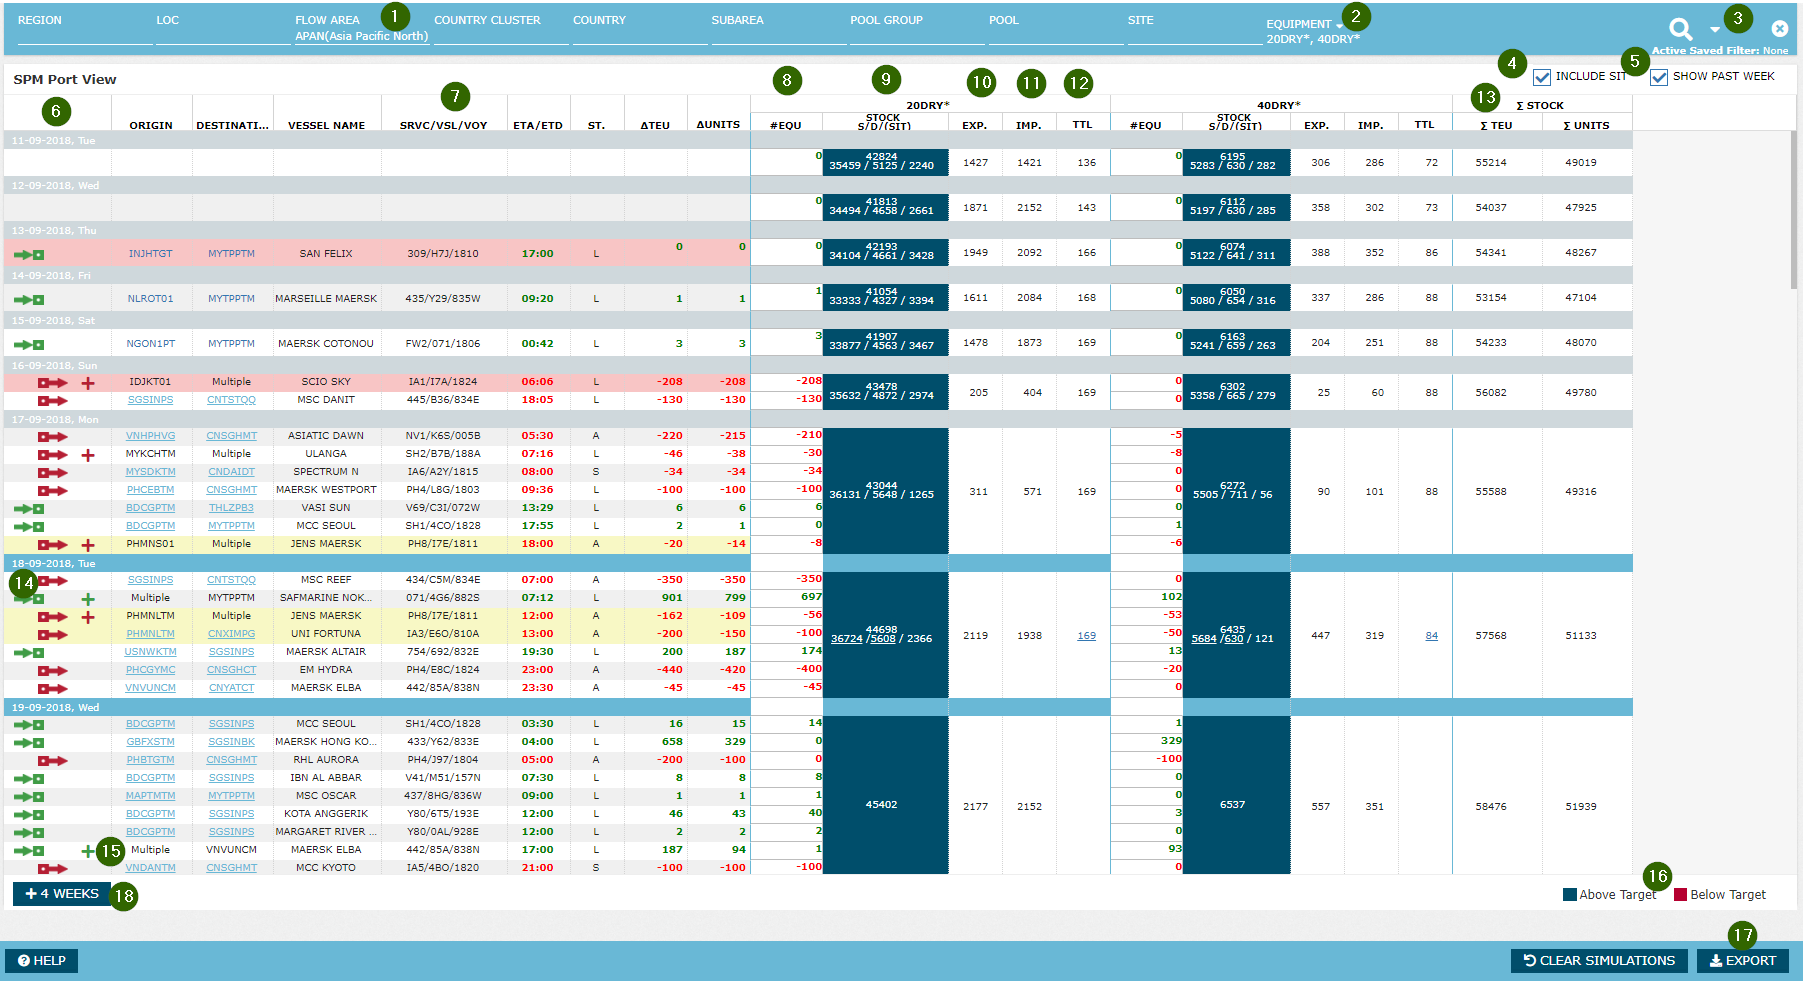
SPM stands for "Stock Projection Module". SPM Port View is the screen where equ planners can view stock development in relation to the impact of OTTs and import/export forecast, and can assess how the stock is developing against the target. The data the system displays on SPM Port View screen is heavily geared towards stock projection of the focal geo/equ type. The numbers the system shows on the OTTs are not raw equipment figures on the OTT record (i.e. S, A, L, D) but specifically how much impact the OTT has on the stock projection. If an OTT has no more impact on stock projection, the system does not display the OTT. In this regard, it is different from e.g. OTT Summary, which displays the raw list of OTTs. Similarly, the screen displays the daily forecast numbers calculated decomposed from weekly totals for each day, a detail not visible in other stock development screens. In a way, SPM Port View itemizes stock projection to its granular details. The screen displays up to current + 3 weeks of stock projection by default, with an option to expand to current + 7 weeks. The user can also view the past 7 days from today with actual figures (e.g. actual import/export) on demand. The screen highlights stock levels with colors if it is less than minimum target or more than maximum target. The user can choose to view stock levels including or excluding SIT level, as per their preference. Another feature of this screen is that, the user can modify the numbers on the OTTs and date rows to simulate new figures and run what-if scenarios. Finally, the user can export the data into excel for further analyses and sharing.
Overview
| Feature | Description | |
|---|---|---|
| 1 | Geo Selector | The user can select one geography at a time on this screen, as the aim is to focus on granular details of one geo. Standard geo selector features available, besides limiting the selection to one. See section Using the Global Filter for more details. |
| 2 | Equ Selector | The user can select one or more equipment types. Standard equipment selector features available, but not TEU group selection. The user can construct TEU group level data using the equ selector and checking Total TEU Stock columns. (i.e. choose all dry equ and check Total TEU Stock and this is essentially same as DRY TEU stock) See section Using the Global Filter for more details. |
| 3 | Include SIT | The user can choose to view stock figures and TSL including SIT detail or not. If the user selects a site, this flag is disabled as one site cannot have stock in transit. Read more on SIT in Current Stock. Note that, when Include SIT = Yes, the system adds average daily SIT level to MinTSL and MaxTSL to ensure a fair comparison (i.e. Stock including SIT vs Target including SIT) See Design Notes section on this page for more details. |
| 4 | Show Past Week | Toggle to display 7 past days from today. |
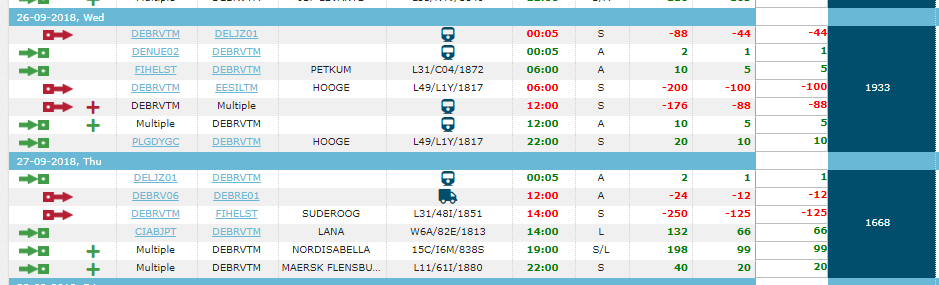
| 5 | Date | The system displays each OTT that affects the stock projection of selected geo/equ type combination;
ROCK sorts the OTTs in ascending order on ETA/ETD. |
| 6 | OTT Schedule | Two points to keep in mind:
|
| 7 | Change in TEU/Units | The total amount of stock projection impact from the specific row, for all the equipment types currently visible on the screen |
| 8 | #Equ | The amount of stock projection impact from the specific equ type in Units. (i.e. referred to as "contribution" in stock projection logic in Projected Stock) |
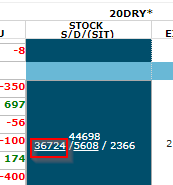
| 9 | Stock (S/D/SIT) | Stock level for the specific day for the specific equ type. Sound/Damaged split available only for Today and Past days. Today refers to current stock level, past days numbers refer to opening stock levels and future days stocks refer to expected opening stock levels. (Read more on these principles in Stock Calculation section) ROCK displays SIT value only if the user selects Include SIT = Yes at the sub-filter. See RKEM Mapping to see the rules of actual stock calculation based on RKEM. |
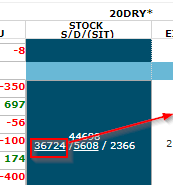
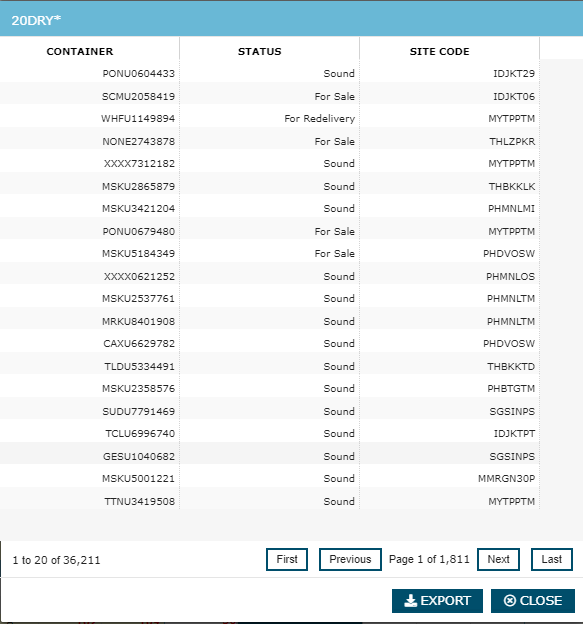
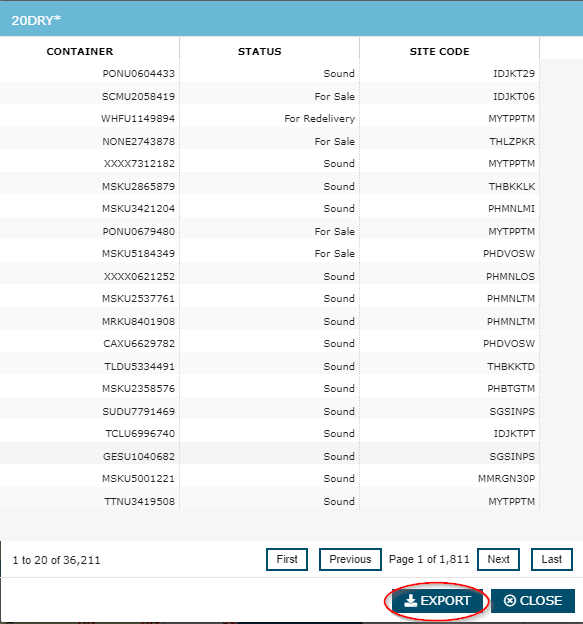
| 10 | Sound/Damaged List | On Today stock, the system displays Sound and Damaged figure as a hyperlink. When the user clicks on Sound link, the system displays a pop up window which lists the actual containers counted in Sound figure on the source cell along with Container ID, container condition (see Current Stock for more details on container conditions) and the site where the container lies. The user can export the list of containers from the pop up. The same goes for Damaged and Total Loss link figures for Today.
Container lists are not available for past and future days. |
| 11 | Export Pickup | Remaining export pick up for Today, actual export pick up for past days, and daily export pick up forecast for future days. For future days, the system decomposes weekly forecast into daily forecast and writes the daily amount. For Today, it is Remaining Export = Daily Forecast - Actual of Export Today. See RKEM Mapping to see the rules of import/export level calculation based on RKEM. ROCK splits the weekly forecast into days based on past 8 weeks actuals. See Forecast Decomposition section on this page for more details. |
| 12 | Import Return | Remaining import return for Today, actual import return for past days, and daily import return forecast for future days. For future days, the system decomposes weekly forecast into daily forecast and writes the daily amount. For Today, it is Remaining Import = Daily Forecast - Actual of Import of Today. ROCK splits the weekly forecast into days based on past 8 weeks actuals. See Forecast Decomposition section on this page for more details. |
| 13 | Total Loss | The amount of containers in stock which are marked as Total Loss by the system. (see Current Stock for more details on container conditions) Blank for future days, as a projection of TTL is not viable as of writing this. |
| 14 | Total Stock in TEU/Units | The total amount of stock from the specific row, for all the equipment types currently visible on the screen |
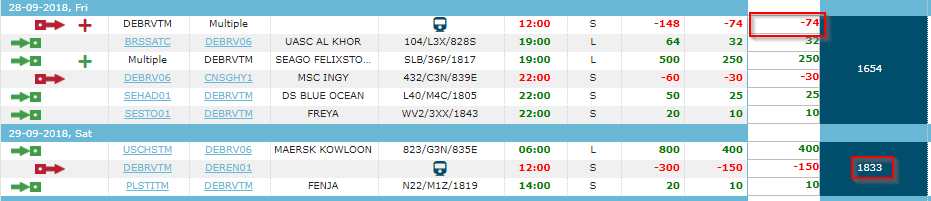
| 15 | Above/Below Target | If the stock level of a certain day is above the maximum TSL for the day, the system sets the stock cell in blue. If the stock level of a certain day is below the minimum TSL for the day, the system sets the stock cell in red. TSL is set at week level (Read more on Manage Stock Factor Target Stock Levels) and the system enforces the same TSL for all days of the calendar week. Note that, if there is no TSL data found for a specific geo/equ type/week combination or the stock is between MinTSL and MaxTSL, ROCK does not highlight the cell. |
| 16 | OMIT/Mismatch Case Non optimal case | If there is a GSIS OTT with vessel OMIT or mismatch case, the system displays the OTT row with red background color. See GSIS Schedule Updates to read more on these cases |
| 17 | Export to Excel | Exports the grid into excel with full time horizon (from -7 days to current + 7 weeks) |
| 18 | +/- 4 Weeks | Toggles between Current + 3 Weeks vs Current + 7 Weeks for stock projection horizon. |
| 19 | Multiple Group | For each activity line, when there is more than one planned OTTs (OTTs in Suggested or Approved status) on the vessel activity, the system by default collapses them into one aggregated line or expand to multiple lines. The user can expand as necessary. |
| 20 | Onboard Group | When there are more than one OTTs discharging to the same site on the same call on the same vessel, they might be grouped under a collapsible Onboard row, if they fit certain conditions. See Onboard Logic in OTT Summary for details of onboard logic. |

Practical Use
Positioning/Evacuation Simulation on OTT Row
The user can perform positioning/evacuation simulation on SPM Port View using on the equ figures of an existing row or the date row. The user can simulate both when the row is expanded or collapsed.
Load OTT
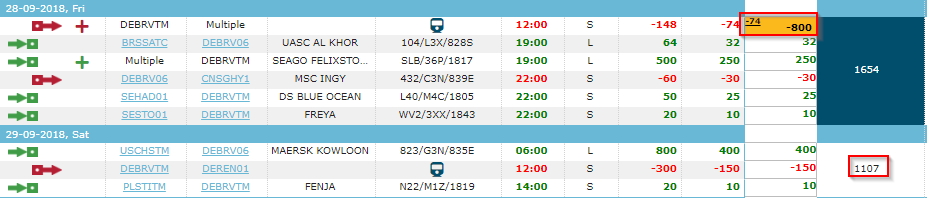
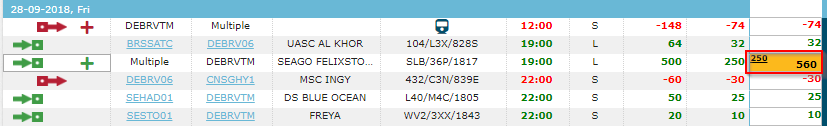
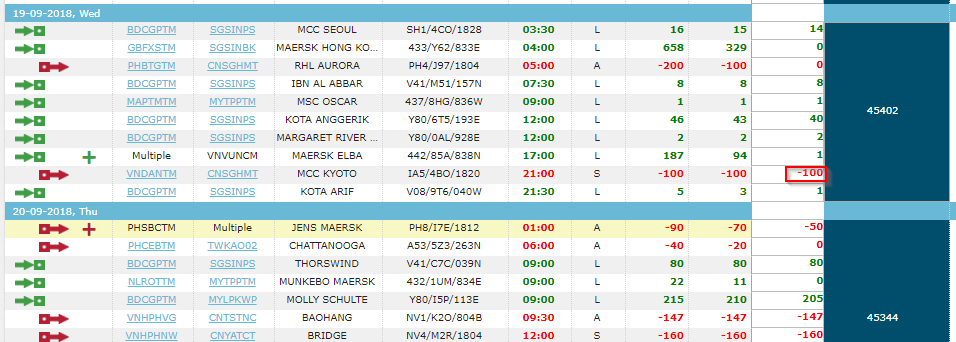
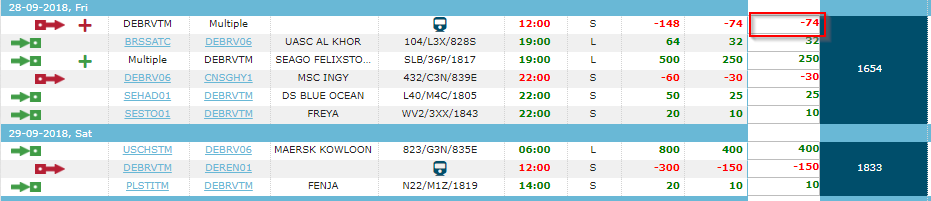
For a Load OTT, the user double clicks on the equ figure cell of his choosing and the system turns the field into an input field. The user types in an integer, in order to simulate a new amount of evacuation on the OTT. The system blocks any character entry that does not follow an integer pattern. When the user is done, he presses Enter key on the keyboard in order for the simulation to effect. If the user has entered a positive integer, the system automatically returns it to a negative integer to make the cell a negative number, to make it consistent with the Load rows' negative impact on projected stock.
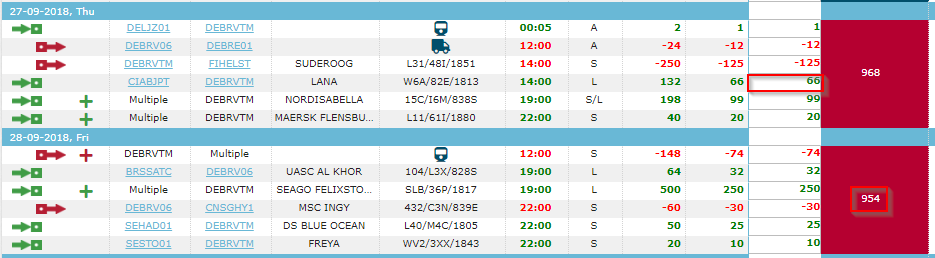
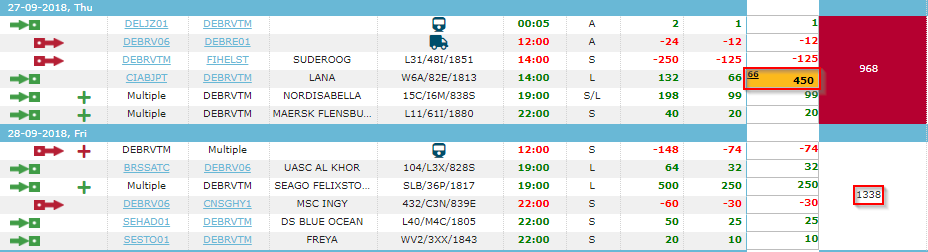
In the example below, the user enters 800 as evacuation simulation, and the system automatically turns it to -800, before applying the simulation to stock projection for the following days. When the system applies the simulation, it also changes the style and content of the simulated cell. The cell colors changes to Orange, and the system automatically carries the original value of the equ cell to the top left corner of the cell in smaller font size:
Discharge OTT
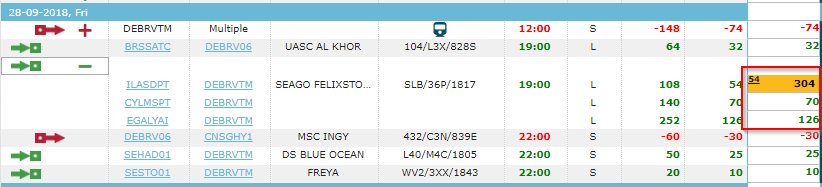
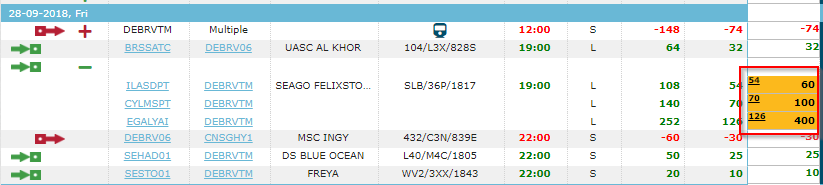
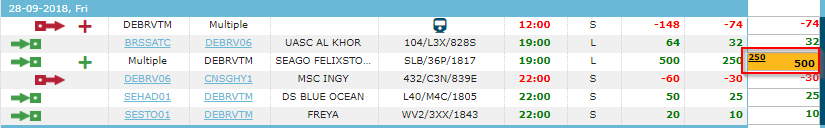
For a Discharge OTT, the user double clicks on the equ figure cell of his choosing and the system turns the field into a blank input field. The user types in a positive integer, in order to simulate a new amount of positioning on the OTT. The system blocks any character entry that does not follow a positive integer pattern. When the user is done, he presses Enter key on the keyboard or skips the cell in order for the simulation to effect. If the user has entered a negative integer, the system automatically returns it to a positive integer to make the cell a positive number, to make it consistent with the Discharge rows' positive impact on projected stock. In the example below, the user enters -450 as positioning simulation, and the system automatically turns it to 450, before applying the simulation to stock projection for the following days. When the system applies the simulation, it also changes the style and content of the simulated cell as described for Load OTT simulation above.
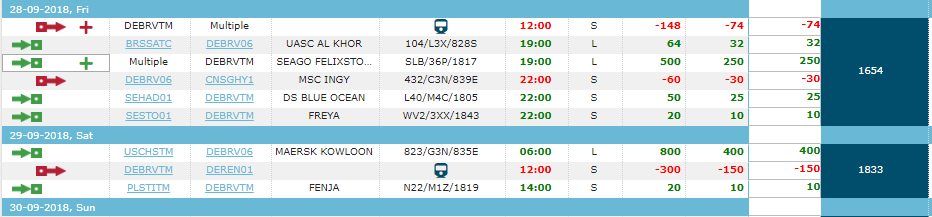
Expand row when Collapsed row Simulated
The user can expand a collapsed row when there is already simulation in place on the collapsed row. In this case, when the row is expanded, the system takes the delta impact on the simulation from the collapsed row, and applies the delta as a simulation to the first row under the collapsed row and runs the simulation towards the future days. This choice of design is arbitrary, as there is no sensible way of distributing the simulation entered when the row was collapsed.

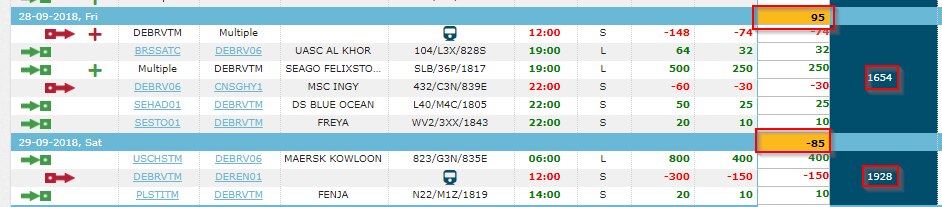
Collapse Rows when Expanded Rows Simulated
The user can also collapse a row while there is simulation in place in one or more of the expanded rows. In this case, the system aggregates the total delta from the simulated cells of expanded rows and adds this to the equ cell of the collapsed row as simulation value.
Positioning/Evacuation Simulation on Date Row
The user can also add simulation using the cell on the date row. This might be required when simulating additional flow on a hypothetical schedule (e.g. preparing extra-loader scenario) The user can enter either positive or a negative number. Same stock impact and highlighting rules apply as above.
SIT OTTs in SPM
Note that SPM Port View does not display SIT OTTs for the selected geo, even if Include SIT is selected. This is simply due to the fact that the screen would be flooded with too many lines, impairing the view for several days of stock development.
Design Notes
Forecast Decomposition
Both auto and manual forecasts are originally provided at week level, which is the most granular level feasible to forecast for both manual and auto forecast. Though ROCK system needs to be a projection at daily level. This requires ROCK to split the weekly forecast to daily level using the past 8 weeks' actual import/export trends.
Average SIT
Calculation of Average SIT
In order to use in Stock vs Target comparison including SIT level, the system calculates average SIT (AvgSIT) per each geo higher than site and adds this to MinTSL and MaxTSL. AvgSIT is calculated as per the rules below:
- AvgSIT is calculated for every geo in the geo table, besides site (i.e. Pool, Pool Group, Subarea, Country, Country Cluster, Flow Area, LOC, Region)
- AvgSIT is calculated for every equipment type in ROCK.
- AvgSIT is calculated as a rolling average by using the same SIT numbers (Units) that are available in Stock Performance Graph. The AvgSIT is calculated by taking an average of all daily SIT calculations within following time slice: 'current day -10 days' to 'current day - 100 days'.
Example: if AvgSIT is calculated on 01-08-2017, then timeslice to be used is 22-07-2017 to 23-04-2017 - AvgSIT is calculated once every Sunday.
The system saves each AvgSIT calculation as historical AvgSIT for that geo/equ associated to the week starting after Sunday.
Use of AvgSIT in Targets
- When calculating e.g. min TSL of a geo, the system uses Min_TSL value from all the sites under the geo, in TSL table and adds the AvgSIT value calculated for the geo in PBI 6981.
Example: If a Pool 1 has 3 sites with respective Min TSL of 20DRY*: [Site 1: 100, Site 2: 300, Site 3: 50] and Pool 1 has AvgSIT of 130
Then this pool has (100+300+50) + 130 = 580 MinTSL.
This approach is applied for each day in the future where site TSL data is available
- The system always has an AvgSIT value to use for stock projection and TSL If the new avg SIT calculation for the geo has not been completed yet or missing for some reason, the system uses the last available value from the past month's calculation and does not just consider avg SIT = 0.
- When comparing past target vs stock, the system uses the AvgSIT that was relevant for that specific day.
Example:
- It is 29th of September 2017 and I am checking target vs stock for a ESALR on 30th September 2017. The system uses the AvgSIT from the latest calculation before today, 29th Sep 2017.
- It is 29th of Sep 2017 and I am checking target vs stock for a ESALR on 1st Jun 2017. The system uses the AvgSIT from the latest calculation before 1st Jun 2017