Introduction
By knowing the current stock, the expected demand (i.e. forecast of import and export events) and planned empty container positioning (i.e. OTTs), it is possible to project what the stock will be on a future day. To get a general intuition about stock numbers in ROCK, the Topic Stock should be read first. This section goes into a bit more detail regarding Projected Stock. The stock projection logic is shown in many screens in ROCK, including:
- Position Plan Simulation
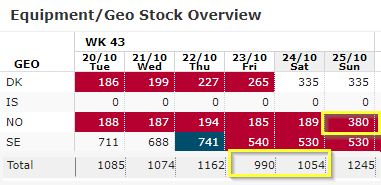
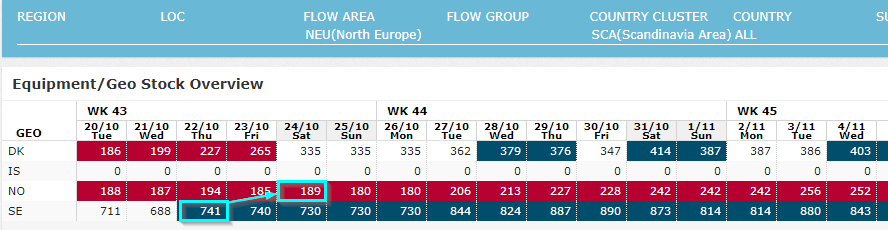
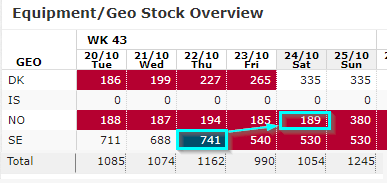
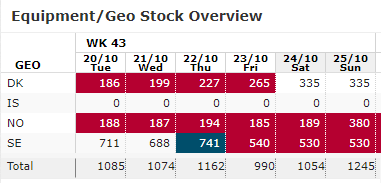
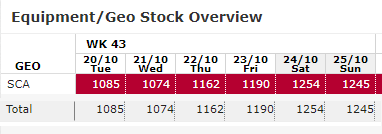
- Equipment/Geo Stock Overview
- Global Stock Chart
- SPM Port View
- Stock Performance Graph
Stock Projection Formulas
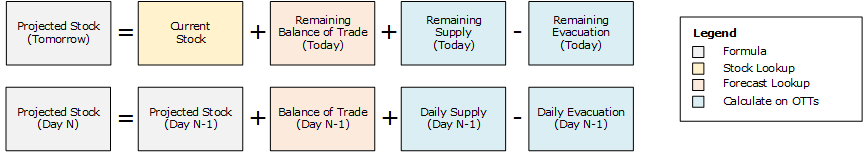
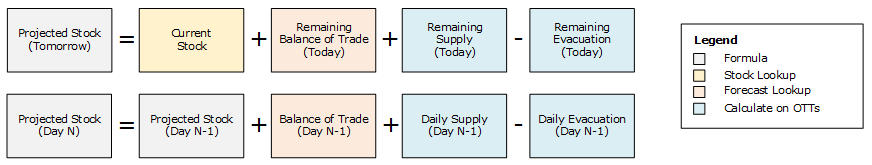
To project stock to a future day N, it is necessary to apply a combination the below formulas, depending on how many days into the future stock is being projected. The first formula projecting the stock of tomorrow must always be used on to determine tomorrows stock, based on remaining operations of today. The second formula must be used on all consecutive days, until the projected stock of day N has been determined. The stock projection formulas are intended to be applied on-the-fly, to consider the all relevant inputs, that are changing constantly.

Considerations
Based on the formulas, the contribution from OTTs are calculated as a projection of flows and contribution of balance of trade from the forecast is calculated as a projection of demand.
The sections Flow Projection and Demand Projection goes into more detail about important considerations, including:
- How long should we expect planned volume to be loaded and discharged? (Projection cut-off)
- How do we handle projection when another subtypes is loaded, compared to what was planned? (Unplanned Subtype Variants)
- How do we handle OTT splits that are being planned? (Pending OTT Splits)
- How do we split weekly forecast to day? (Split Ratios)
- How do we consider actuals from today?
Geo Hierarchy and Intra-Geo Flows
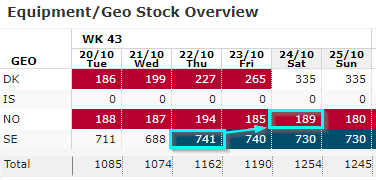
The output of stock projection depends on the geo hierarchy specified in the ROCK report. Stock projection logic will only consider flows in and out of the geo hierarchy, and as a result, all intra-geo flows are ignored. These flows are also known as Stock in Transit.
The below example describes this behavior, and how stock projected will sometimes change, as the geo hierarchy increases.
(1) Planning flows between Countries Given I have pulled a report for "Equipment/Geo Stock Overview" When I analyse the report When I want to manage the imbalance |
 |
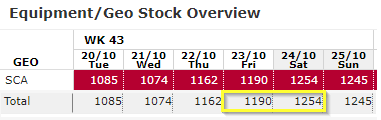
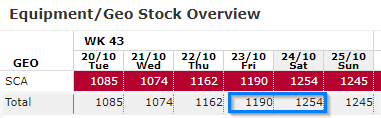
(2) Stock Projection On Country Cluster Hierarchy Given I have pulled a report for "Equipment/Geo Stock Overview" And geo selection is Scandinavia (SCA country cluster). |
|

