Introduction
While SPM Port View is designed to give granular details in relation to stock development for one specific geo, Global Stock Chart allows the user to have a quick glance of stock vs target for current+7 weeks ahead for multiple geos and plan empty flows accordingly. This screen gives a visual indication of stock vs target situation with a more refined logic than other stock development screens which just simply highlight the stock red if below MinTSL and blue if above MaxTSL. Instead, Global Stock Chart displays a different indication depending where the stock specifically falls within MinTSL-MaxTSL range on the day with the lowest stock level during the week. With these features, Global Stock Chart is the starting point for day-to-day stock management, where the user can drill down to specific geos after. On top of stock level analysis, the user can access past current and past stock/import/export/imbalance levels and view/export the list of containers for longstanding container management.
Contents
Page Access
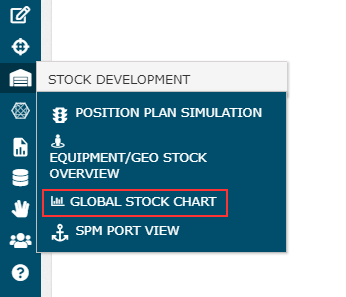
The user can access the screen under Stock Development category in ROCK menu:
Overview
| Feature | Description | ||||||||||||||||||||||
|---|---|---|---|---|---|---|---|---|---|---|---|---|---|---|---|---|---|---|---|---|---|---|---|
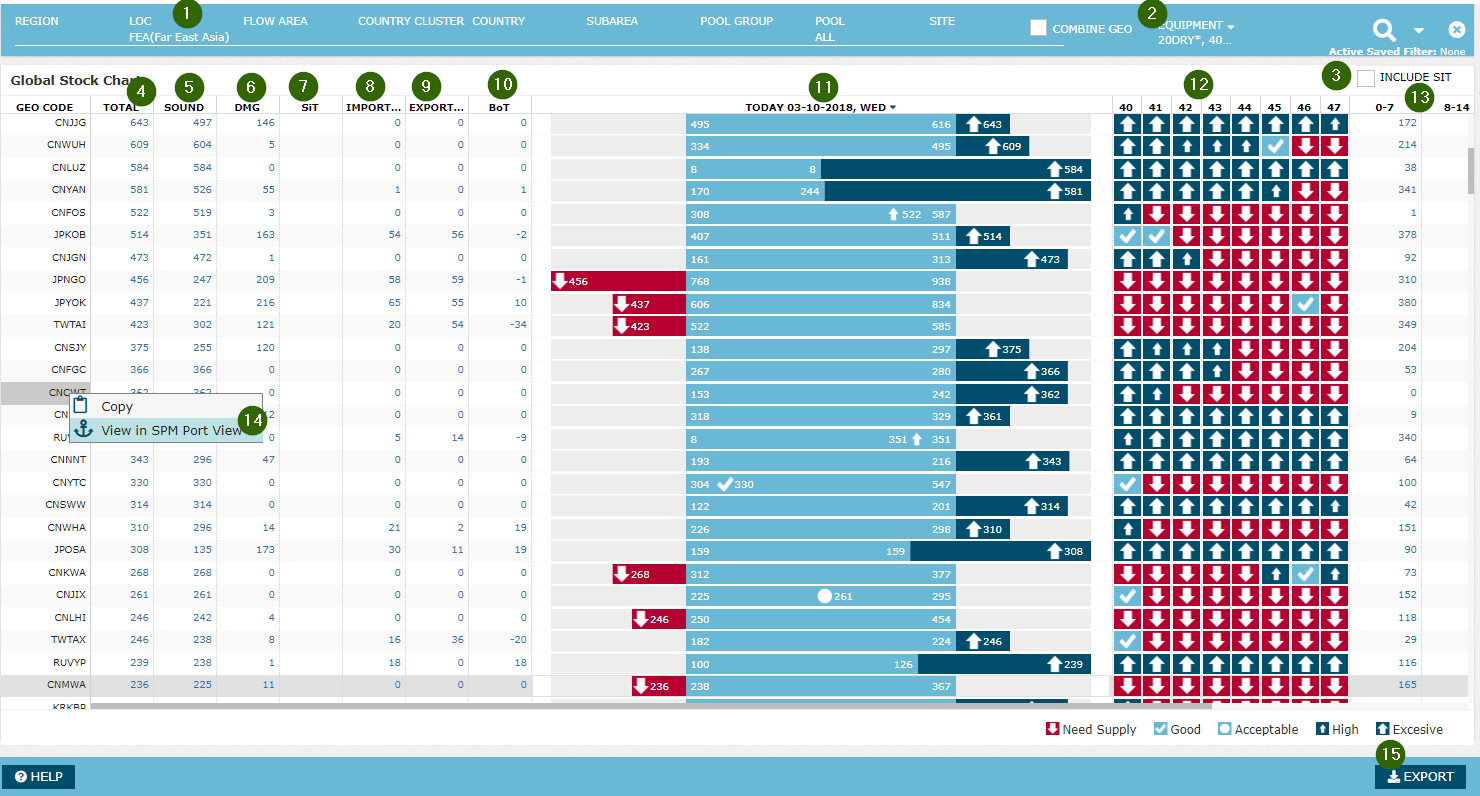
| 1 | Geo Selector | The user can select one or more geographies at a time on this screen. Standard geo selector features available, plus the ability to combine multiple geos. See section Using the Global Filter for more details. | |||||||||||||||||||||
| 2 | Equ Selector | The user can select one or more equipment types or TEU groups. Standard equipment selector features available. See section Using the Global Filter for more details. | |||||||||||||||||||||
| 3 | Include SIT | The user can choose to view stock figures and TSL including SIT detail or not. If the user selects a site, this flag is disabled as one site cannot have stock in transit. Read more on SIT in Current Stock. Note that, when Include SIT = Yes, the system adds average daily SIT level to MinTSL and MaxTSL to ensure a fair comparison (i.e. Stock including SIT vs Target including SIT) See Design Notes section on SPM Port View for more details. | |||||||||||||||||||||
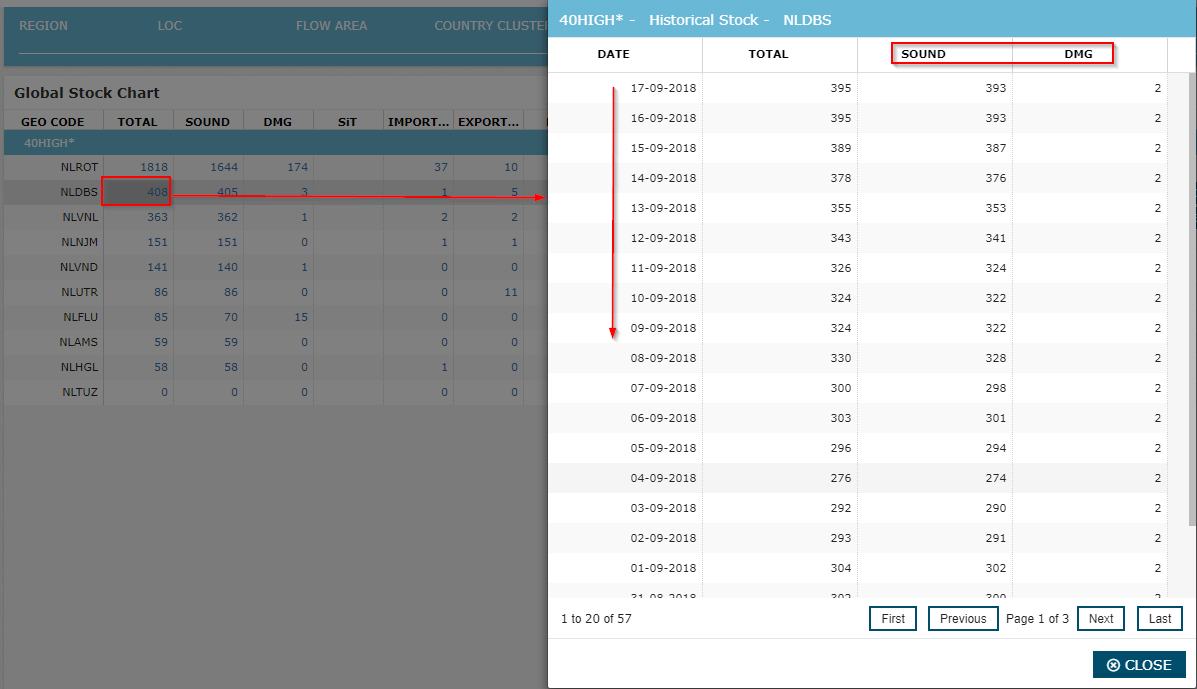
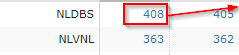
| 4 | Total | Displays current stock. The system displays the number as a hyperlink. When the user clicks on it, the system displays a pop up with historical stock data. The user can see past 8 weeks of stock data with Sound vs Damaged condition
| |||||||||||||||||||||
| 5 | Sound | Displays the current Sound stock level. Opens the same pop up as Total cell above | |||||||||||||||||||||
| 6 | Damaged | Displays the current Damaged stock level. Opens the same pop up as Total cell above | |||||||||||||||||||||
| 7 | SIT | Displays current SIT level | |||||||||||||||||||||
| 8 | Import | The total amount of actual Import Return during Today since 00:00 | |||||||||||||||||||||
| 9 | Export | The total amount of actual Export Pick up during Today since 00:00 | |||||||||||||||||||||
| 10 | BoT | Balance of Trade = Import Return - Export Pick Up (aka Imbalance) | |||||||||||||||||||||
| 11 | Today | Displays a visual which represents the minTSL-maxTSL range for each geo/equ combination for today, and the current stock number and an indication of how the stock is doing against TSL:
| |||||||||||||||||||||
| 12 | Future Weeks | After Today column, the system displays 8 columns, representing projected stock for development this week and 7 future weeks. The stock projection indicator on these columns, is based on the lowest level that the stock will reach during the focal week. The reason to use minimum stock during the week instead of e.g. average stock: Many sites have one vessel call per week, which is the only chance to evacuate surplus containers or receive more containers for export needs. If the site can reach a desired stock level at their lowest during the week, then it has desired level of stock in general for that week. E.g. It is normal and acceptable for a surplus site to keep building stock all week, as there is no way to evacuate the surplus until the vessel arrives. This site is expected to hit a desired stock level once a week, right after the loading on the vessel. The fact that the site is above TSL for the other days of the week is actually insignificant. Similarly, for a deficit site, the stock level right before discharge from the vessel (i.e. lowest stock) determines whether the site has enough containers to cover exports or not. The future week cells display and indication of how projected stock will do against TSL. The user can hover mouse to see the projected stock level for that day.
Note that the deviation in Case 3 is the same for Today stock and future stock, but the icon is different. If the stock ended up at this level for Today, it is acceptable. Though for the future, seeing the same range in projected stock might mean potential build up of stock above target, so the design is more alarming for the future weeks for the same deviation range. | |||||||||||||||||||||
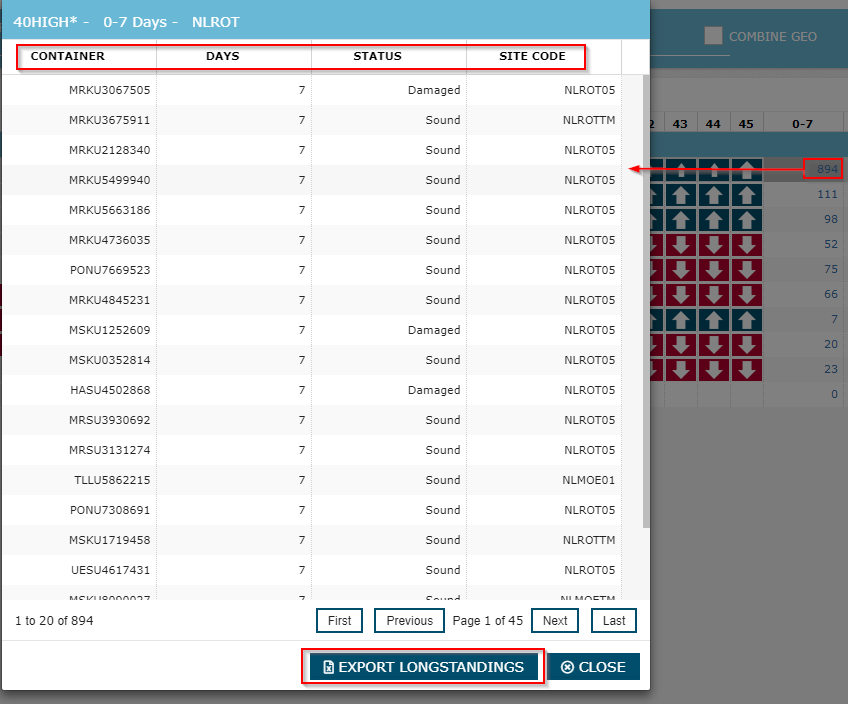
| 13 | Longstanding Ranges | The number of longstanding containers that has been in empty at location for 0-7, 8-14, 31-60, 61-180 and 180+ day ranges. When the user clicks on it, the system displays a pop up with the list of containers for the selected range displaying the list of containers with Container ID, days in stock, condition and site code. When the user exports to excel on this pop up, excel output includes the full list of containers from all longstanding ranges.
| |||||||||||||||||||||
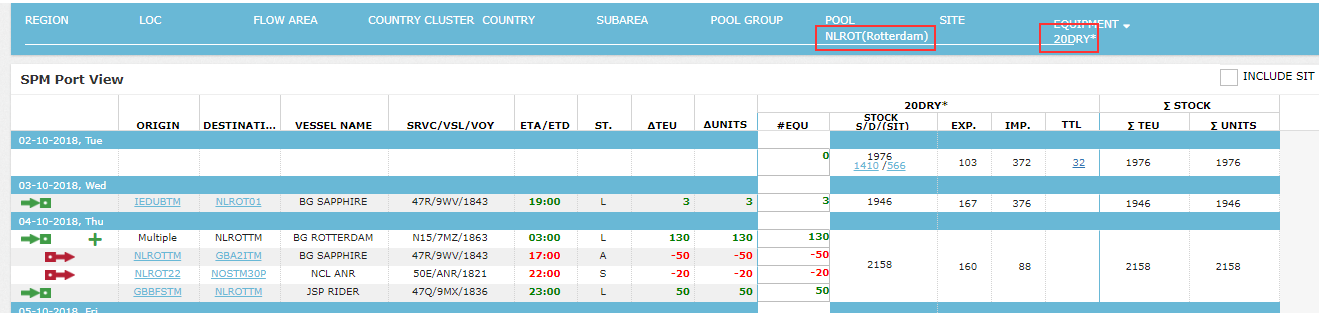
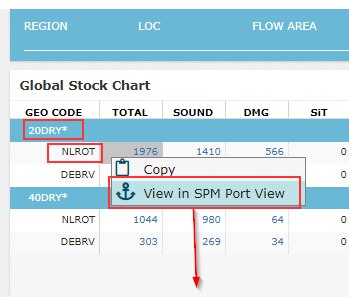
| 14 | View in SPM Port View | When the user right-clicks on any row on Stock Chart grid, a command appears: 'View in SPM Port View'. When the user clicks on this command, the system opens SPM Port View screen in a new tab, automatically populating Global Filter selections with the geo/equ row on Global Stock Chart and fetching data:
| |||||||||||||||||||||
| 15 | Export | Exports the contents of the grid to excel |


