Introduction
Positioning Planning Screen is the the one where equ planners can view stock development in multiple geographies for multiple equipment types or TEU Groups at the same time. The user can choose to combine stock levels and targets for multiple geographies. The screen highlights stock levels with colors if it is less than minimum TSL or more than maximum TSL, whenever TSL is available. The user can choose to view stock levels including or excluding SIT level, as per their preference. Another feature of this screen is that, the user can add stock simulations and run what-if scenarios. Finally, the user can export the data into excel for further analyses and sharing.
Contents
Page Access
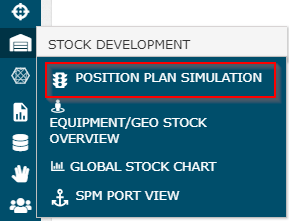
The user can access the screen under Stock Development category in ROCK menu:

Overview
| Feature | Description | |
|---|---|---|
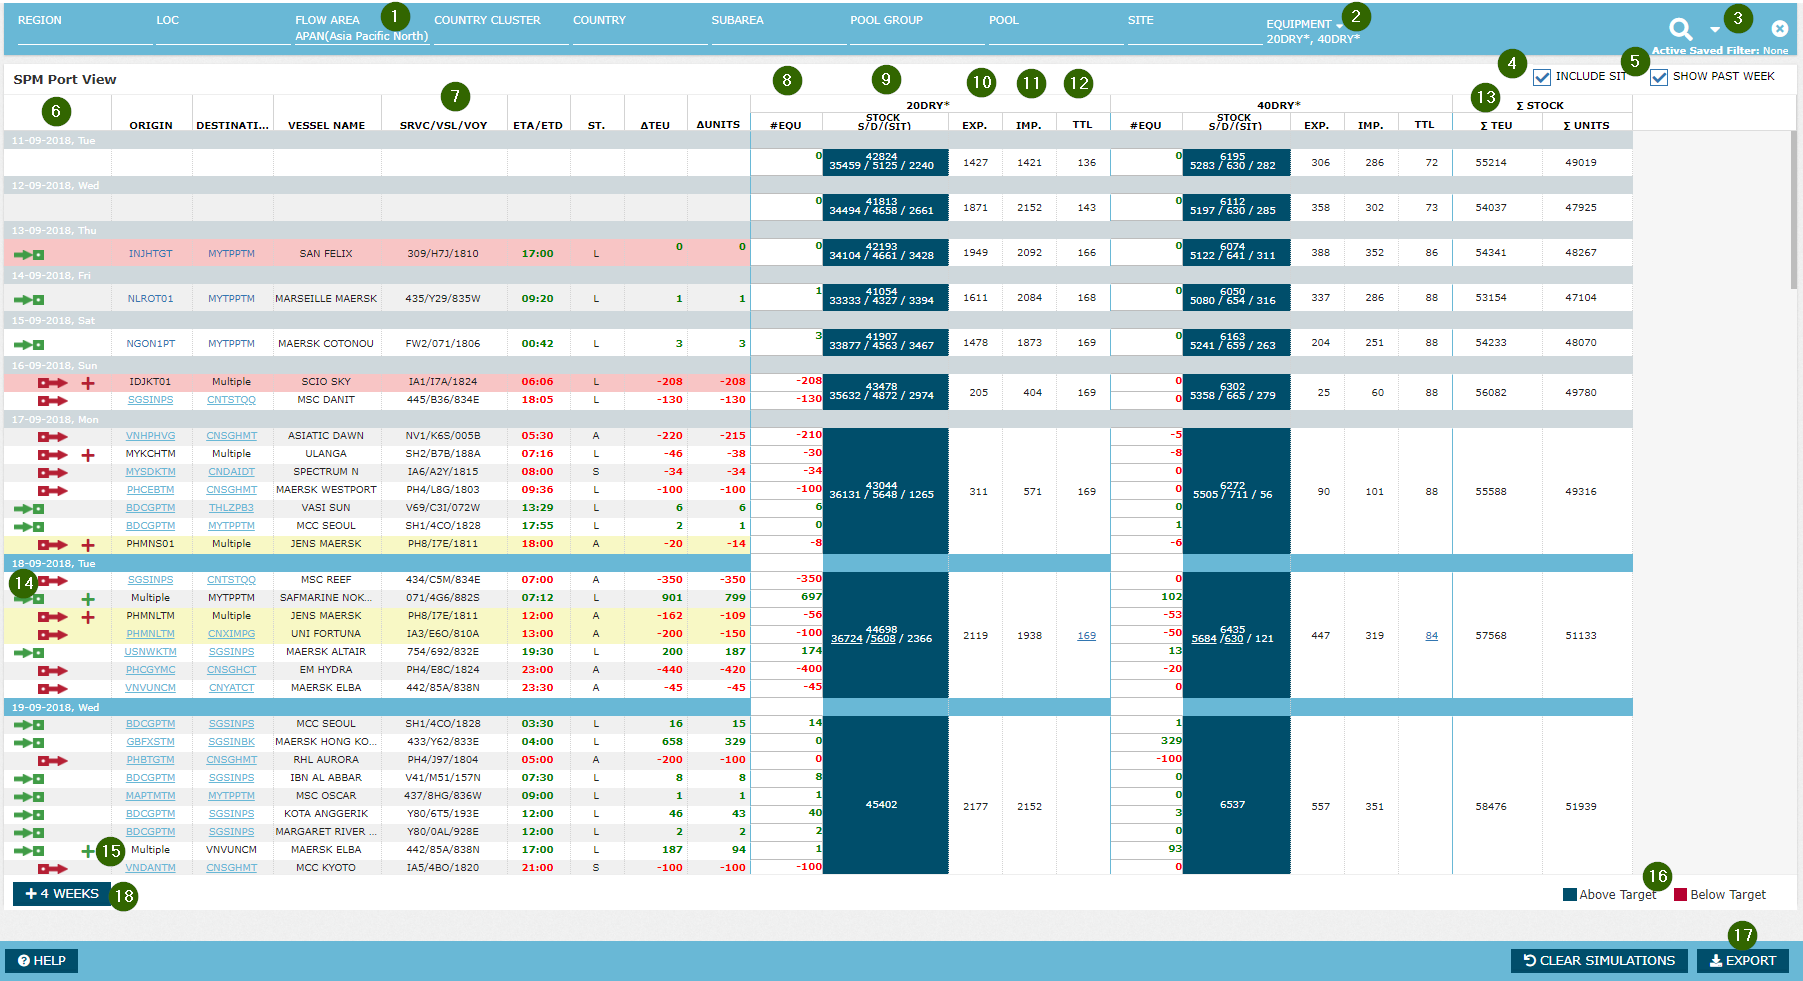
| 1 | Geo Selector | The user can select one or more geographies at a time on this screen. Standard geo selector features available, plus the ability to combine multiple geos. See section Using the Global Filter for more details. |
| 2 | Equ Selector | The user can select one or more equipment types or TEU groups. Standard equipment selector features available. See section Using the Global Filter for more details. |
| 3 | Weeks Plan | The user can choose time horizon to show stock projection. Default is 4 weeks (i.e. current+3) the user can choose up to 8 (i.e. current+7) weeks. |
| 4 | Include SIT | The user can choose to view stock figures and TSL including SIT detail or not. If the user selects a site, this flag is disabled as one site cannot have stock in transit. Read more on SIT in Current Stock. Note that, when Include SIT = Yes, the system adds average daily SIT level to MinTSL and MaxTSL to ensure a fair comparison (i.e. Stock including SIT vs Target including SIT) See Design Notes section on SPM Port View for more details on this. |
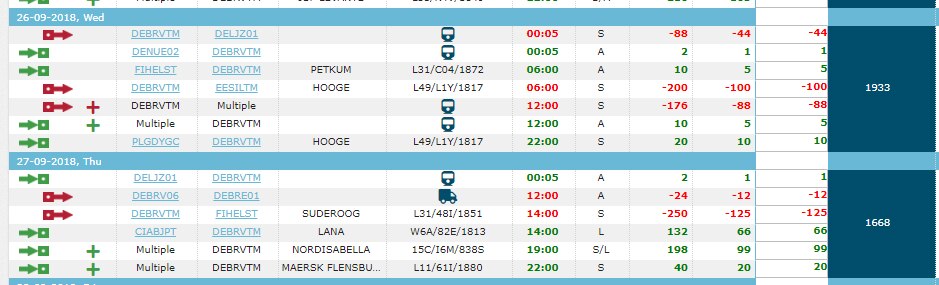
| 5 | Show Past Week | Displays 7 past days' stock levels from today |
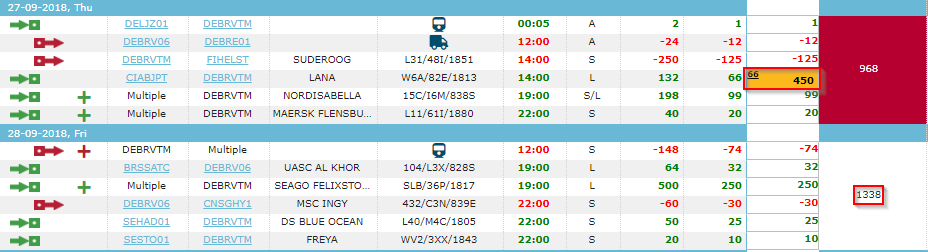
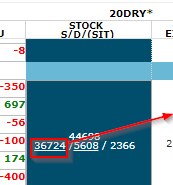
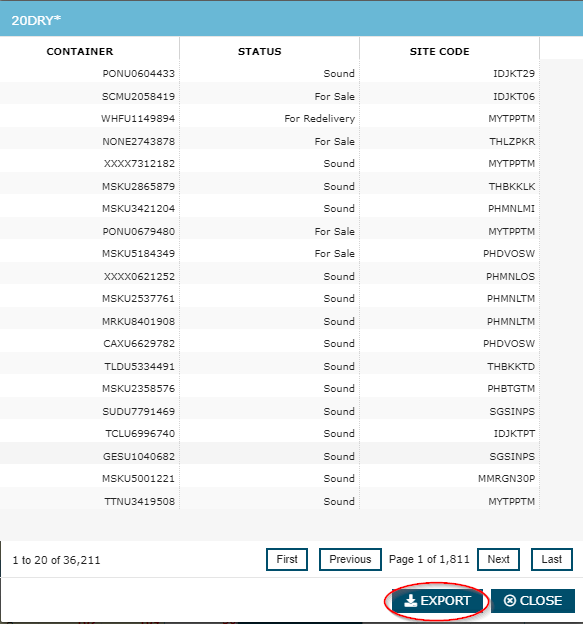
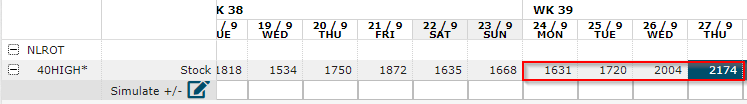
| 6 | Stock | ROCK displays actual opening stock for past days, current stock for today, and projected opening stock for future days, as per general principles of stock calculation discussed in section Stock Calculation |
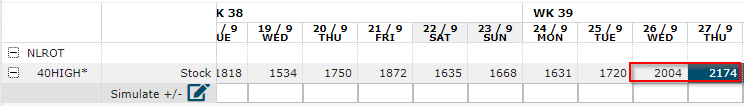
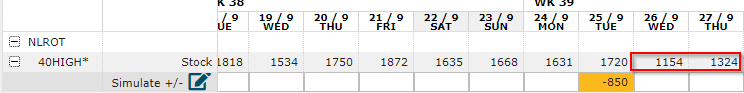
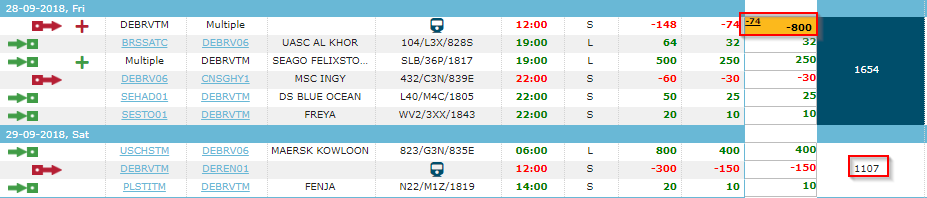
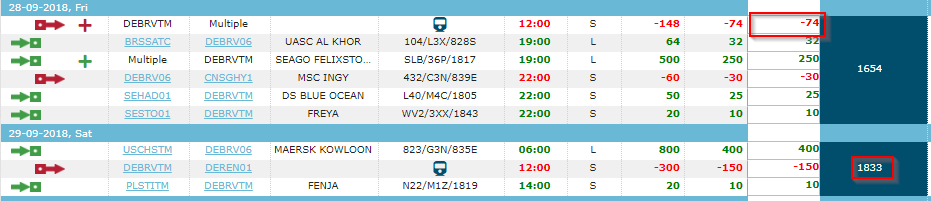
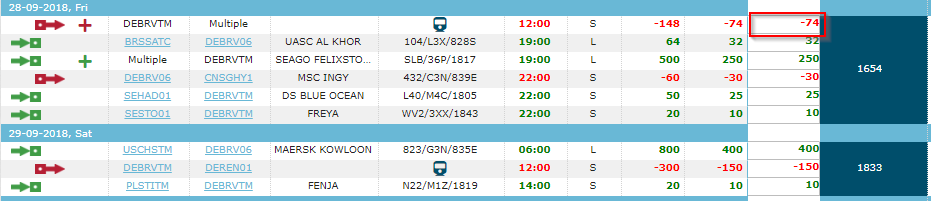
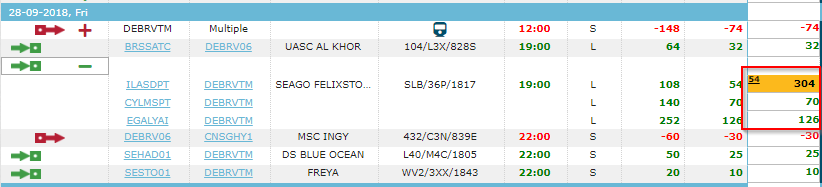
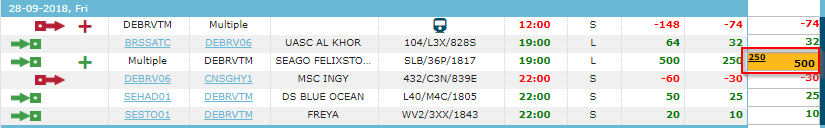
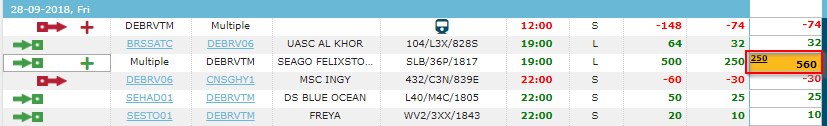
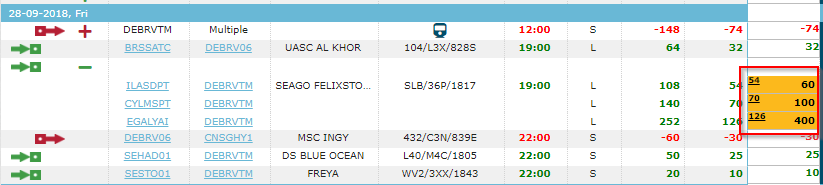
| 7 | Simulation | The user can enter numbers to simulate positioning or evacuation and run what-if scenarios:
|
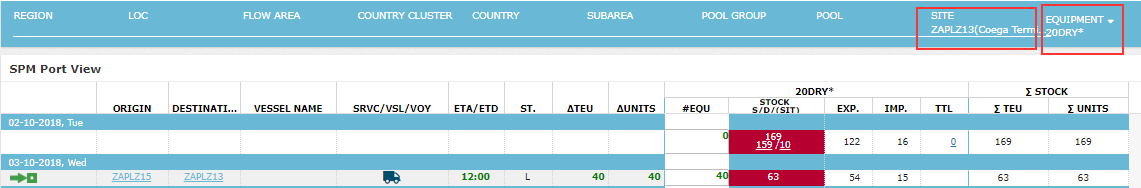
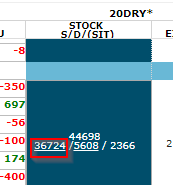
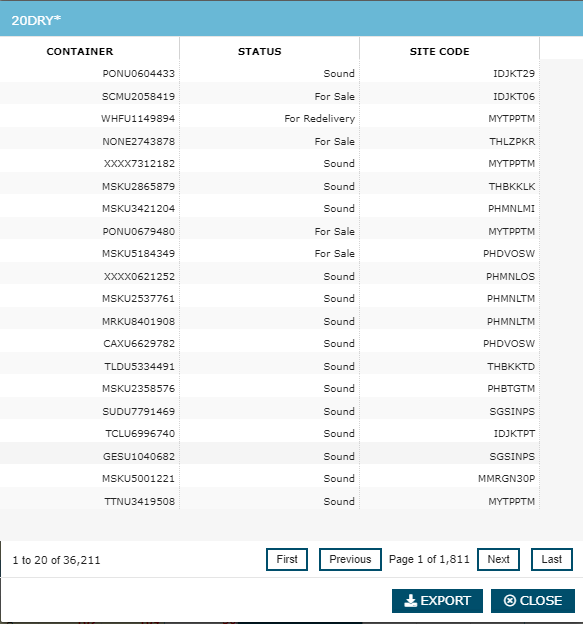
| 8 | View in SPM Port View | When the user right-clicks on any row on PPS grid, a command appears: 'View in SPM Port View'. When the user clicks on this command, the system opens SPM Port View screen in a new tab, automatically populating Global Filter selections with the geo/equ row on PPS and fetching data: 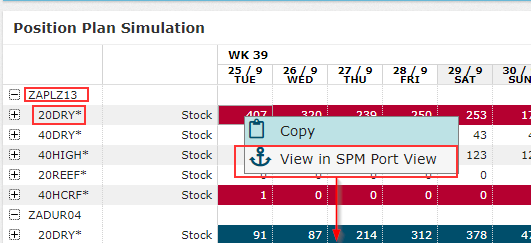
|
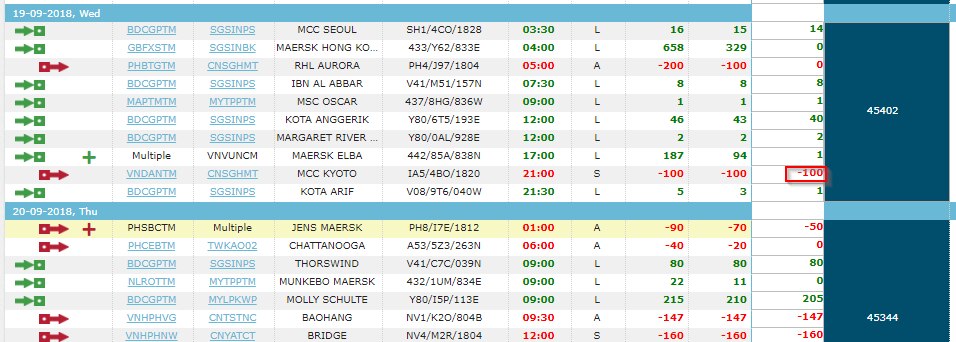
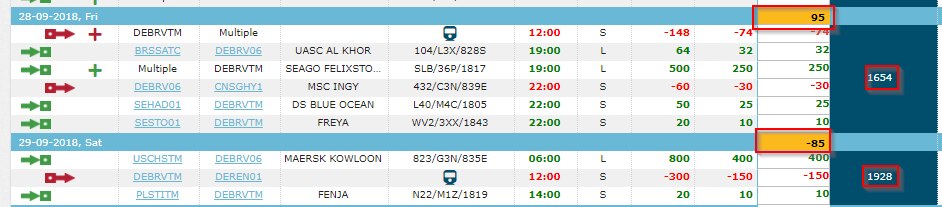
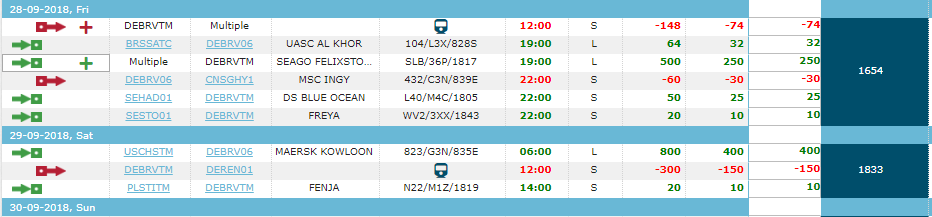
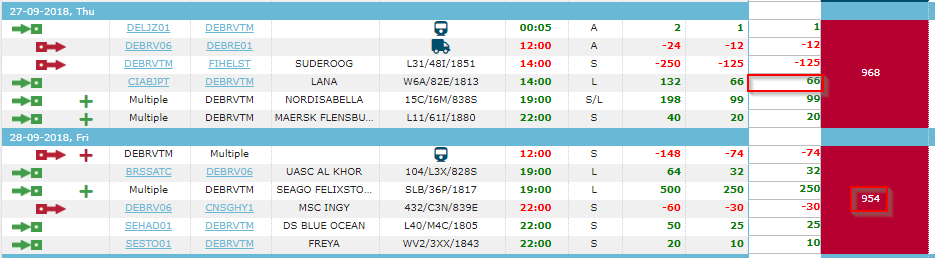
| 9 | Above/Below Target | If the stock level of a certain day is above the maximum TSL for the day, the system sets the stock cell in blue. If the stock level of a certain day is below the minimum TSL for the day, the system sets the stock cell in red. TSL is set at week level (Read more on Target Stock Level) and the system enforces the same TSL for all days of the calendar week. Note that, if there is no TSL data found for a specific geo/equ type/week combination or the stock is between MinTSL and MaxTSL, ROCK does not highlight the cell. |