Introduction
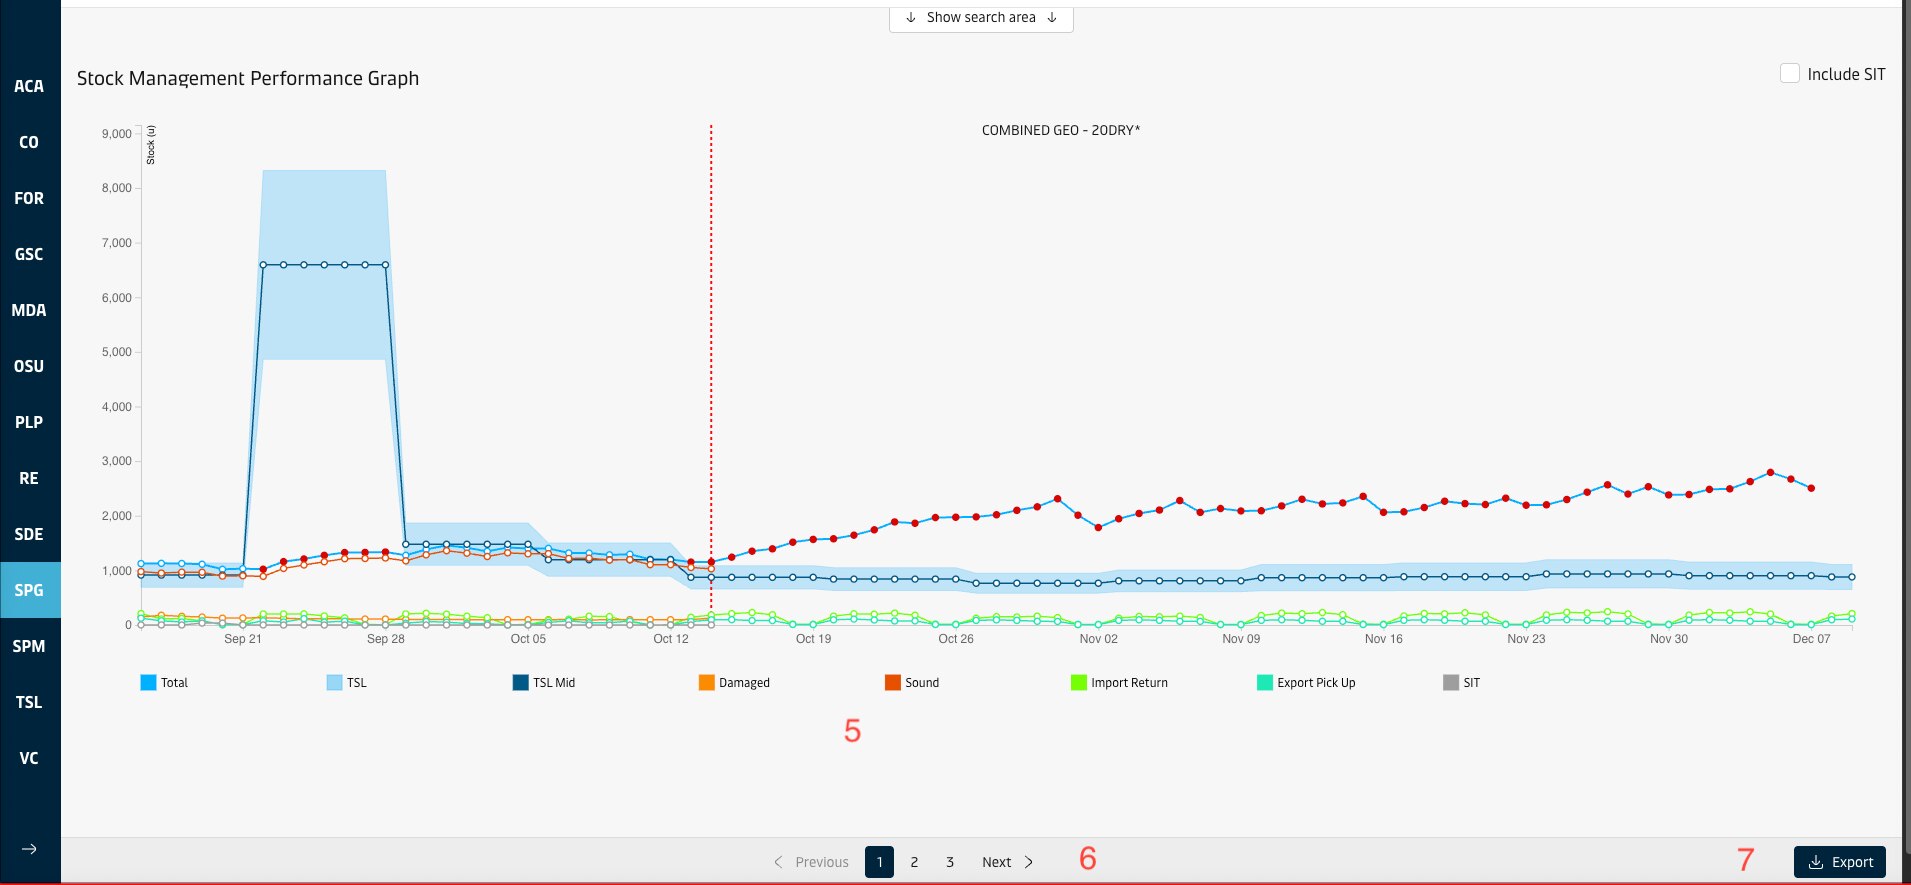
Stock Performance Graph is designed to allow monitoring whether stock levels were up to targets in the past. It displays total/sound/damaged stock level, TSL range, import return, export pick/up and SIT level from today to 2 years back on a line graph. The user can view multiple geographies each one on a different graph, or aggregate data for multiple geos in one graph. The user can choose to view single equipment types one by one or combine multiple equipment types and view the numbers calculated for the combination in Units or TEU terms.
Overview
Feature | Description | |
|---|---|---|
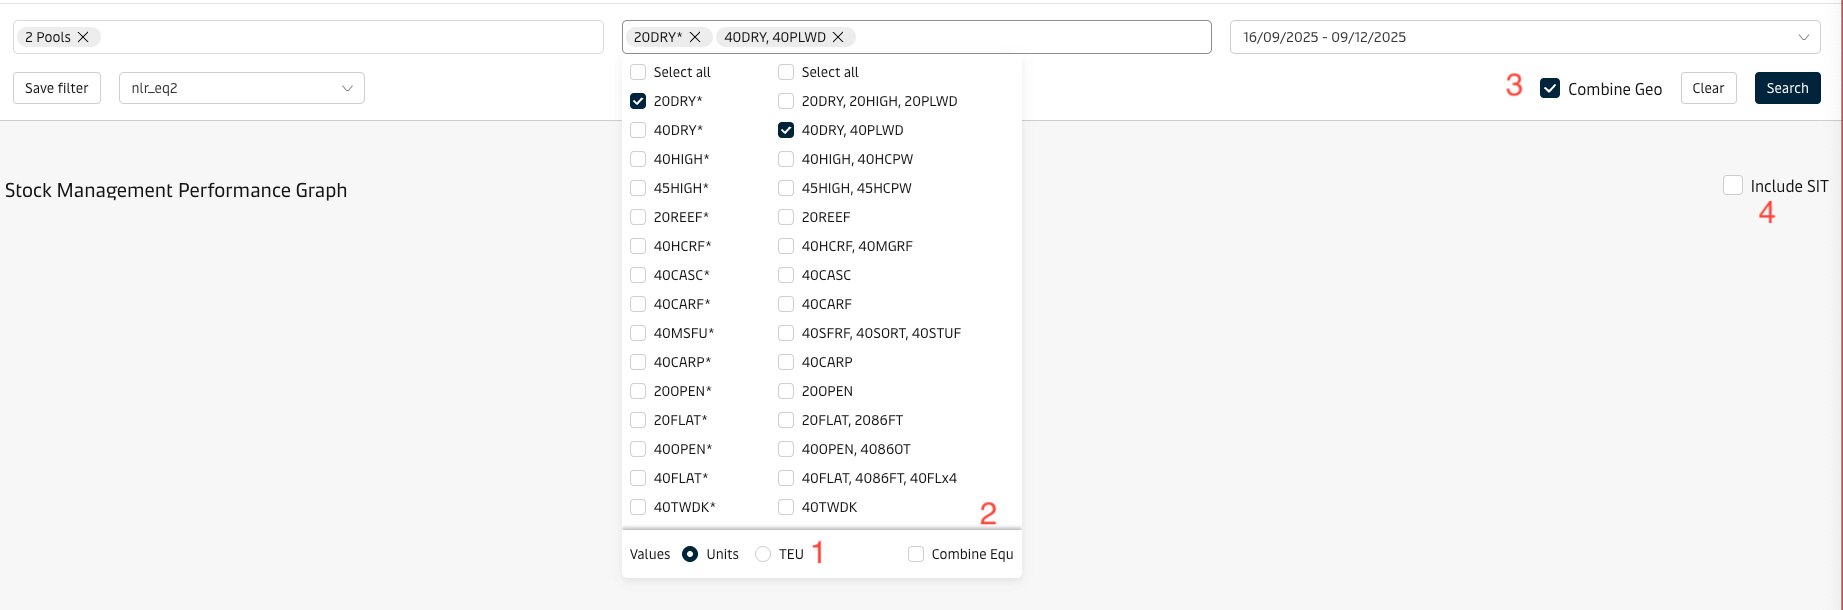
| 1 | Geo Selector | The user can select one or more geographies at a time on this screen. Standard geo selector features available, plus the ability to combine multiple geos. |
| 2 | Equ Selector | The user can select one or more equipment types, and can choose to combine equipment types or view them individually, and view the numbers in Units or TEU terms. Standard equ selector features available. |
| 3 | Date Range | The user can choose up to 2 years back as the start date, using the date selector. Default is past 8 weeks |
| 4 | Include SIT | The user can choose to view stock figures and TSL including SIT detail or not. If the user selects a site, this flag is disabled as one site cannot have stock in transit. Read more on SIT in Current Stock. Note that, when Include SIT = Yes, the system adds average daily SIT level to MinTSL and MaxTSL to ensure a fair comparison (i.e. Stock including SIT vs Target including SIT) See Design Notes section on SPM Port View for more details. If the user selects a site, this flag is disabled as one site cannot have stock in transit. |
| 5 | Total | Displays the stock level for the focal day (Sound+Damaged) |
| 6 | Sound | Displays the sound stock level for the focal day |
| 7 | Damaged | Displays the damaged stock level for the focal day |
| 8 | Min/Max Target Stock Level | Displays MinTSL/MaxTSL range.(See Manage Target Stock Levels for more details) |
| 9 | Import Return | Displays the actual import return for the focal day |
| 10 | Export Pickup | Displays the actual export pick up for the focal day |

Serial Number is screen shot | Description |
|---|---|
1 | Users can view the numbers in Units or TEU terms. |
2 | Users can choose to combine equipment types or view them individually. |
3 | Users can choose to combine Geos or view them individually. |
4 | Users can choose to view stock figures and TSL including SIT detail or not. |
5 | Users can click to show or hide the corresponding line / area graphs. |
6 | Users can click to view the next / previous available chart with data. |
7 | Users can click to have the data for all pages exported to an excel file and download it. |