Introduction
ROCK includes a set of reports to help analyse how we are managing equipment and planning flows.
Terminology used
- Measure: A "measure" is a number that is derived from taking a measurement, e.g. total stock or imports/exports of a day.
- Metric: A Metric is a quantifiable measure that is used to track and assess the status of a specific business process. E.g stock compliance factor
- KPI: A key performance indicator is a metric that is associated with a business outcome
Accessing Forecasting Reports
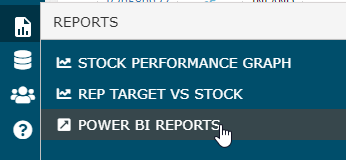
The reports can be accessed through the "POWER BI REPORTS" link in from the navigation menu in ROCK.

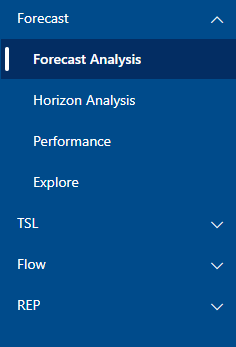
On the Power BI screen there are different sections (e.g. Forecast, TSL, FLOW, REP). Each section will have a few related reports.
Power BI Sections
Forecasting
The forecasting section in Power BI includes a few reports to analyse how forecasting is done over time.
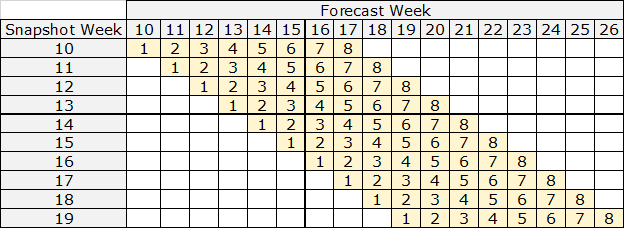
The data is is built from weekly snapshots of auto and manual forecast data from ROCK. Every Wednesday at 00:00 UTC, ROCK will take a snapshot of the current auto forecast values and manual forecast values. This enables the system to track the development of forecast over time. Before making the data available in the Power BI report, the current data on actual import/exports are merged with the data. As a result, the report will present a snapshot of forecast values, but always use update imp/exp actuals from RKEM.
Target Stock Levels
--
Flow
--